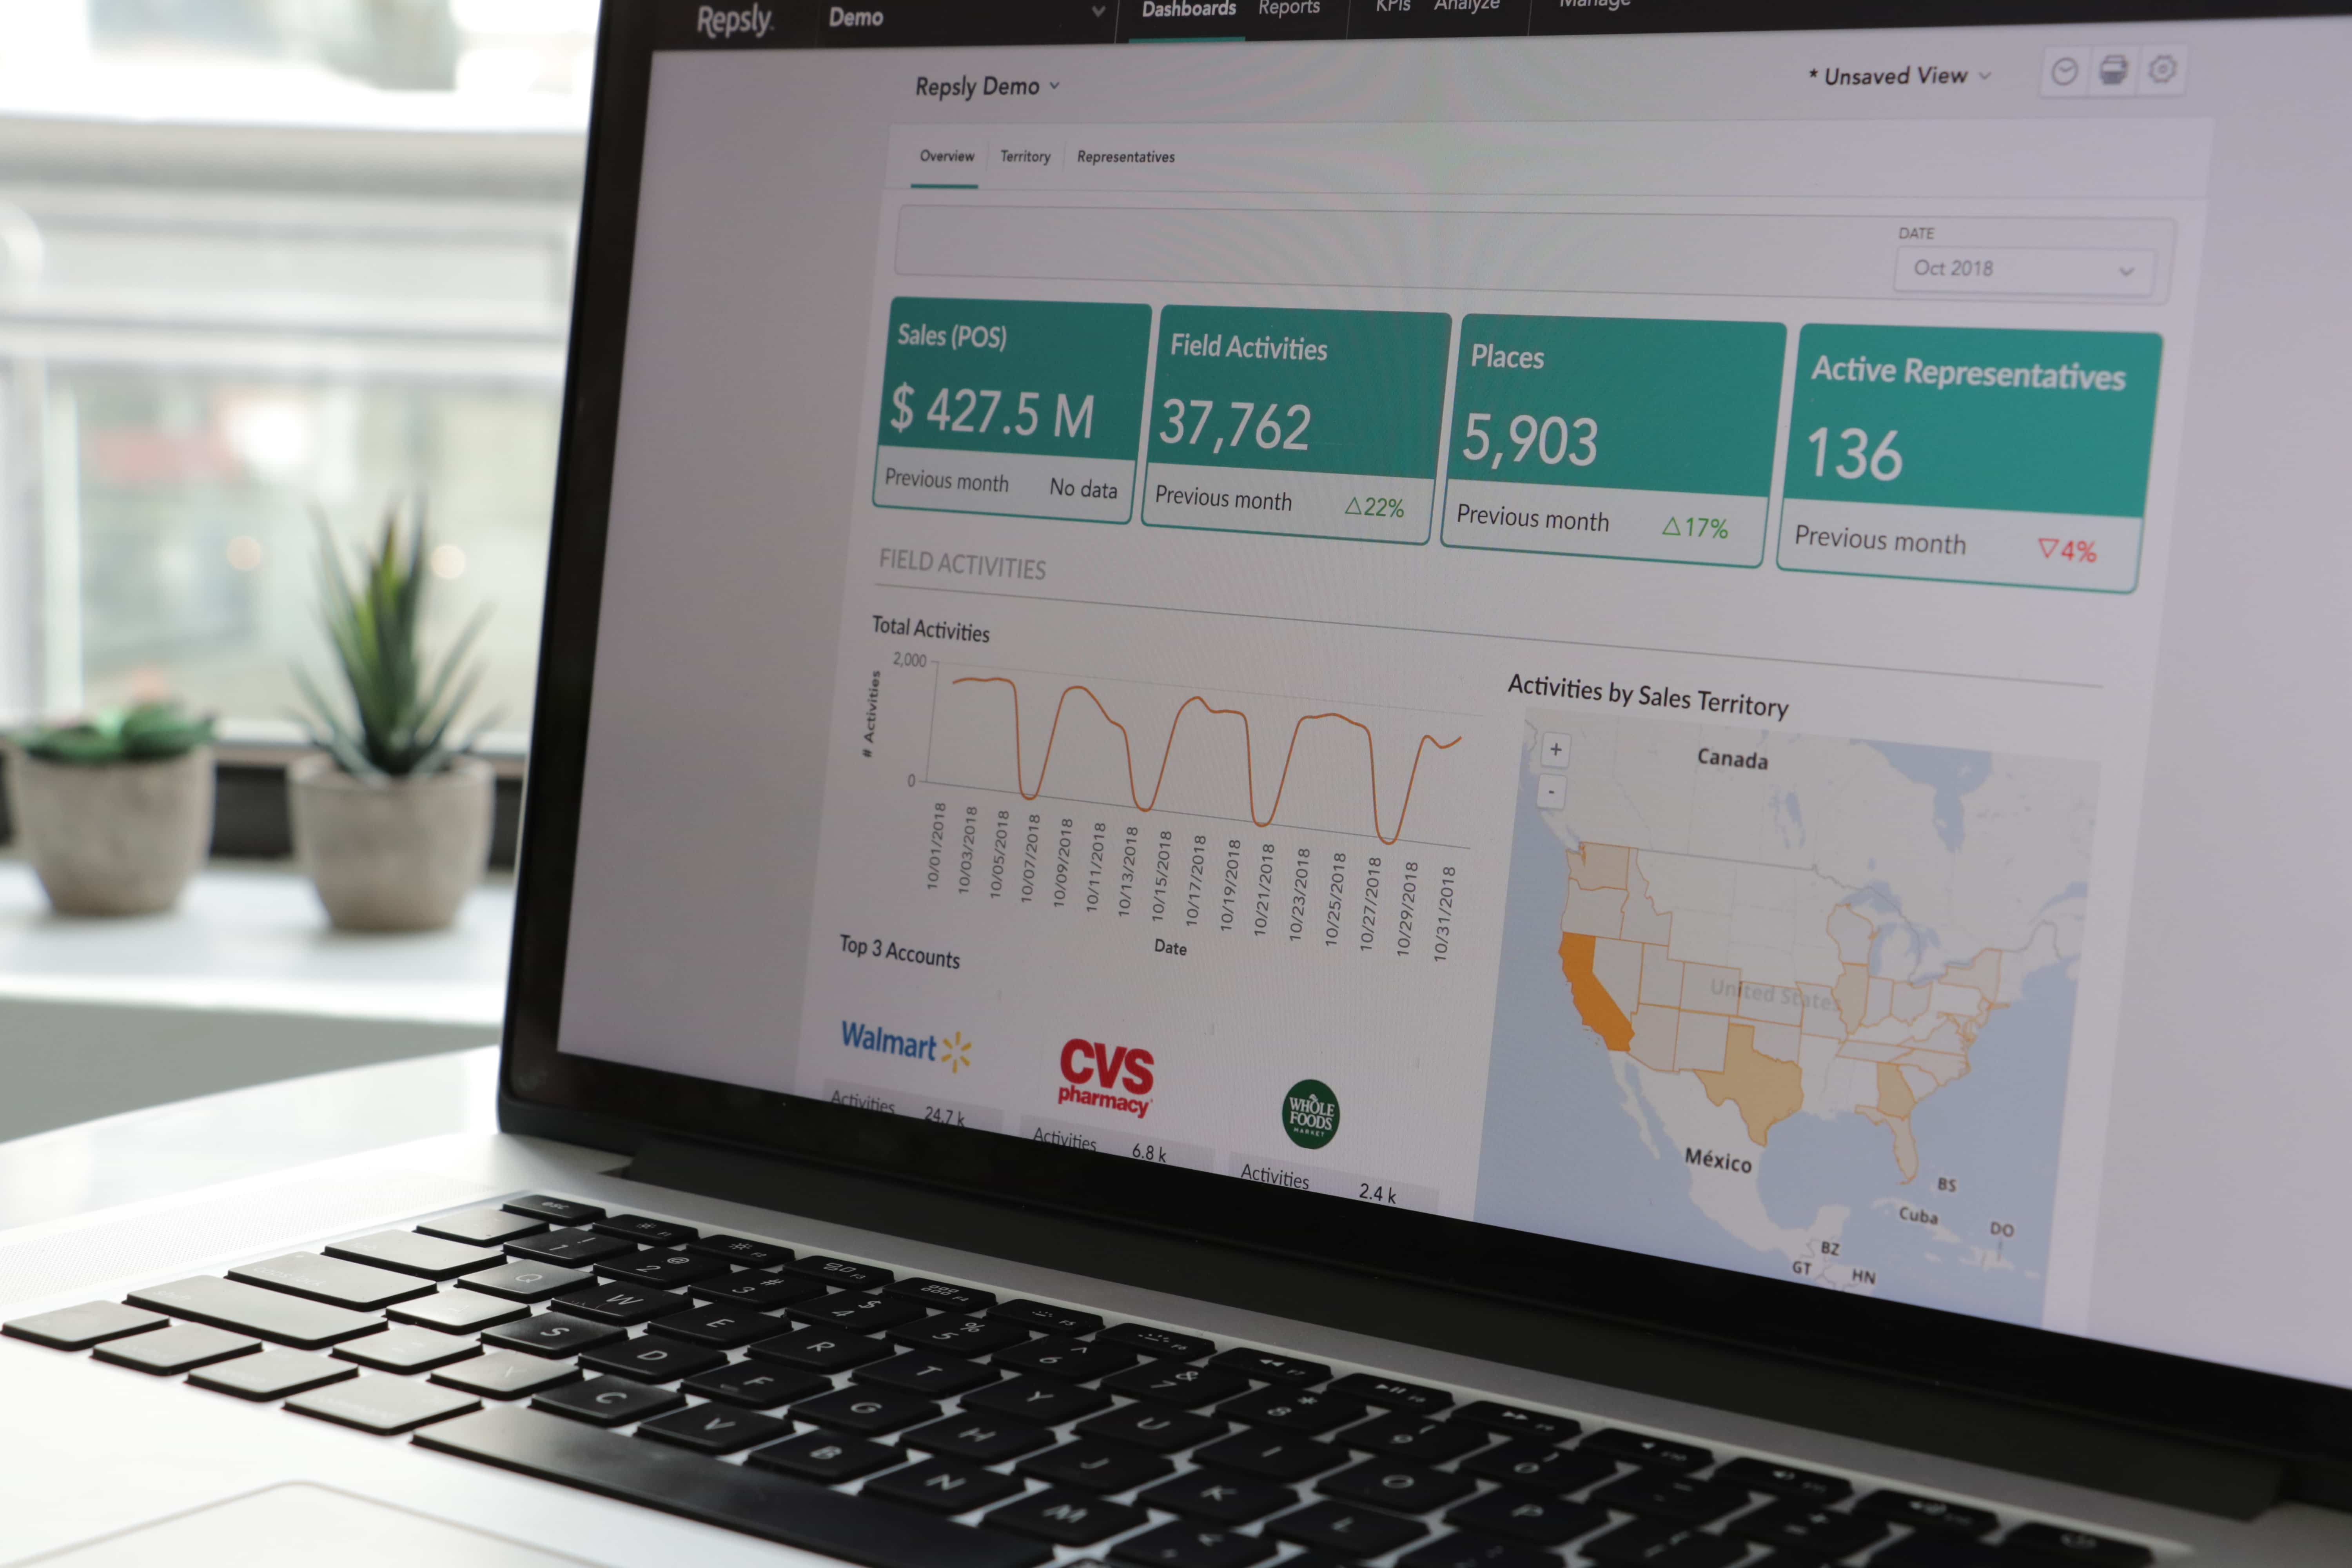
This spring, we released our most anticipated new product yet: an all-new reporting platform that gives field teams everything they need to make data a part of their daily workflow.
In this post, we’ll break down nine of the most powerful new capabilities we’ve packed into Insights Dashboards so you can see exactly why we’re so excited to share it with you!
1. It can show you how and where your products are moving off the shelf
Repsly’s Insights Dashboards can now give brands a picture of where their products are selling fastest — and why. By connecting with point-of-sale data from the largest US grocery retailers, including Walmart, Target, Kroger, and Whole Foods, you can view sales velocity alongside retail execution activity in a single dashboard.
Whether you want to track the success of a new SKU by store location or understand how execution impacts velocity, Insights Dashboards can help you understand where and why your products are moving off the shelf.
2. You can put a dollar value on every void fixed, display installed, or shelf reset
With point-of-sale and retail execution data together in one place, brands can start to measure — and maximize — the impact their field team has on sales. Should your team focus on winning more facings at the home aisle or installing new displays on the racetrack?
Our Sales Impact dashboards make it easy to connect your team’s activity in the field to your brand’s outcomes at the register, so you can answer questions like that in minutes, not hours.
3. You can measure the performance of sales and merchandising programs over time
Beyond your brand’s special promotions and sales campaigns, every field team has core programs that they run during a typical store visit. Whether that’s pulling stock from the back room and resetting the shelf or defending your shelf territory from competitors, you can use Insights Dashboards to help your team get better week after week.
How many stores are we able to visit on average? Should we spend more time with the buyer? How can we more effectively win space on the shelf?
Adding data to the conversation around questions like these helps everyone focus not just on working hard, but improving by working smart every week.
4. You can get alerts on execution and sales gaps by territory, store, and representative
Why wait for a weekly or monthly report to tell you there’s an opportunity to improve when the data is available that same day? With Insights Dashboards, you can get real-time alerts on key sales or execution gaps so you can take action to reclaim lost sales immediately.
Notifications in Repsly are completely customizable, but here’s just an example of the types of alerts you could get:
- One of your highest-volume banners is out of compliance for your latest promotion
- Your best-selling SKU hasn’t been scanned in a store in 2 days
- One of your sales reps is behind goal by more than 15%
- Territory coverage slipped under 30% last week.
5. You can give every stakeholder access to the data that’s right for them
Insights Dashboards makes it easy to give every stakeholder a view of the data they need to do their job more effectively. Not only can you segment territory views for your regional managers, but you can give executive stakeholders a high-level view of performance without diving into the weeds.
Plus, merchandisers and brokers can even create individual dashboards for each of their clients to highlight the work they do for their brand every day.

If you’re not using Repsly yet and would like to learn more about our retail execution software, click on the button below. Look forward to getting to know you!


.png?width=480&height=252&name=PRESS%20RELEASE-2%20(4).png)

