Ensure Display Compliance at Key Retailers
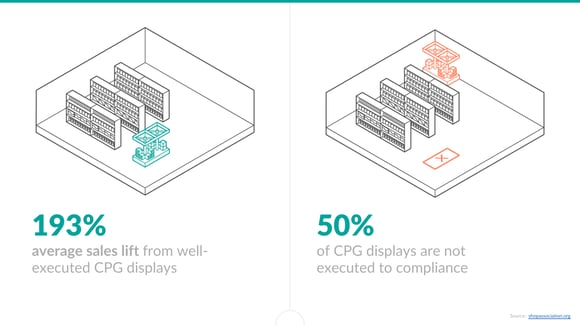
Beyond the traditional sales function, a huge part of improving your sales velocity is ensuring flawless retail execution in your key accounts. While CPG displays have the potential to move the needle on sales by as much as 193%, they’re executed to compliance less than 50% of the time.
As a result, poor retail execution can cost brands as much as 25% of their potential retail sales, according to the Category Management Association.

Innovative CPG brands can use syndicated data to identify noncompliance and win back those sales. By keeping a close eye on sales in stores where you’ve negotiated and delivered a secondary display, you’ll be able to establish baseline metrics for the sales lift you can expect certain promotions to produce in certain accounts. With those baselines in hand, it’ll be clear just a few days after a scheduled promotion whether there’s something wrong with the display setup or location.
From there, data-driven teams can deploy their field team to take action at those target accounts. Armed with POS trends, they’ll be able to start data-driven conversations with the retailers and take the necessary steps to correct the displays and win back those sales.
(To learn more about how to set up this workflow for your field team, check out our webinar on how to fight retailer noncompliance.)
Optimize Promotions to Maximize Incremental Sales by Retail Channel
Any experienced sales manager knows the promotions that drive the most sales in one retailer won’t necessarily work for another. When combined with data about the promotions or merchandising activities your field team is completing in their accounts, syndicated CPG data can give brands insight into exactly which merchandising and trade promotion activities have the biggest effect on sales. (Read more about the power of combining POS data with field activity data in our eBook here.)
For example, Repsly’s retail execution dashboards associate field activities (new facings, demo events, secondary displays, end caps, etc.) with the sales lift you see in each specific account. Over time, CPGs can assign a dollar value to the promotions and merchandising activities their teams complete in the field, allowing them to proactively prioritize the highest-impact activities to move the needle in key accounts.
IRI, Nielsen, and SPINS: Comparing Syndicated Data Providers
There are a few big players in the syndicated data landscape, namely IRI, Nielsen, and SPINS. While their products vary slightly, all three data providers are relatively similar.
All three give brands a cross-channel view of product sales, as well as the analytical tools they need to conduct trend analysis by category, product attributes (“cage-free” vs “free range,” etc.).
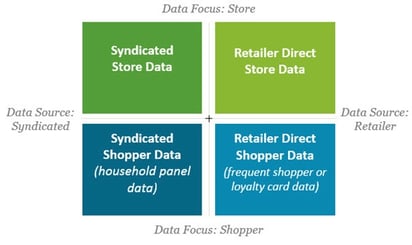
The major difference lies in the store types they source data from. IRI and Nielsen take a broad approach, covering everything from Food, Drug, Mass, Convenience and Club to Military and Dollar.
SPINS, on the other hand, fits into a smaller niche, covering Natural Grocery and Specialty Gourmet. Notably, however, Whole Foods doesn’t make its data available to any syndicated data provider (you have to get Whole Foods scan data directly from the retailer). So while SPINS provides the most comprehensive view of natural channel sales, brands who sell primarily through Whole Foods would need to supplement their SPINS market data with Whole Foods’ retailer direct data.
That’s not to say IRI and Nielsen cover an exhaustive list of retailers either. Trader Joe’s, Costco, and Aldi are among a handful of other large retailers that also limit the use of their data through third-party data services.
The Verdict
If you’re sold in a fast-moving category in the Natural channel, there’s a good chance you’re covered by all three data providers. In that case, you best bet is to simply compare price. If you care exclusively about Natural Grocery or Specialty Gourmet, you may be able to find a less expensive deal through SPINS, since that’s what they cover exclusively.
If you’re sold in a lower-velocity category or smaller retailers, CPG Data Insights reports the vendor may not have your data as well organized and easy to use as more popular channels. So to be sure, contact all three providers and ask to see how your data will be presented. You might find significant differences in clarity and ease-of-use for your category.
Whichever vendor you choose to work with, remember you can do far more with your syndicated CPG data than just performing market analysis or populating product locators. Winning brands use POS data as the backbone of a data-driven sales and retail execution strategy to get a competitive advantage at the shelf.


.png?width=480&height=252&name=PRESS%20RELEASE-2%20(4).png)

